N=1 After 40

Research note

Gray-Market Peptide COAs

A certificate of analysis can be useful evidence, but it is not a safety guarantee. The point of reading one carefully is to separate what the report actually tested from what buyers often assume it proves.

Jump to the COA checklist
Boundary: This is testing literacy, not medical advice, prescribing, dosing, coaching, or sourcing guidance. A COA describes a submitted sample under a stated method. It does not make a product safe, legal, sterile, correctly stored, or appropriate for use.

Why Testing Matters

Gray-market peptide buyers often see a clean-looking COA and read it as a green light. That is too much weight for one document. A report may confirm that one sample had a strong HPLC peak, or that one submitted vial contained the expected mass of the target molecule, but those are narrower claims than product safety.

The important questions are separate: identity, purity, amount, and injectable safety. A strong report tries to answer all four. Most gray-market reports answer only one or two.

The Chain Of Trust Problem

A COA does not test the whole supply chain. It tests the sample that reached the lab. In the gray market, the buyer is still trusting that the tested sample came from the same batch, that the batch was not substituted or relabeled, that storage and handling were reasonable, and that the seller did not selectively test a clean sample while shipping different inventory.

Labels, vial photos, powder color, and seller claims are not identity evidence. They are context. The analytical report is the evidence, and even that evidence has boundaries: sample representativeness, method quality, date, lot linkage, and whether the report can be verified.

Proper testing also costs money. That creates incentives to test fewer samples, skip LC-MS identity, skip injectable-safety panels, or reuse old-looking paperwork. This does not prove a given report is bad. It explains why the details matter.

The Testing Methods

HPLC Purity

High-Performance Liquid Chromatography separates a sample into peaks. With UV detection, the lab can report the target peak as a percentage of the total UV-detected peak area. This is why peptide reports often say something like 99.6% purity.

That number is useful, but it is easy to overread. HPLC purity is usually area percent, not a direct statement that the vial is 99.6% target peptide by mass. It can miss water, salts, counterions, some non-UV-active contaminants, and impurities hidden under the main peak. The chromatogram matters because it lets you see the main peak, shoulders, smaller peaks, baseline noise, and whether the integration looks plausible.

HPLC-only identity should be treated as incomplete. A clean peak at an expected retention time can still be the wrong molecule, a closely related molecule, or a co-eluting mixture. Retention-time matching is useful, but it is not the same as LC-MS mass confirmation.

LC-MS Identity

Liquid Chromatography-Mass Spectrometry keeps the separation step and adds mass detection. For peptides, that mass evidence is a much stronger identity check than retention time alone because it asks whether the molecule has the expected molecular weight.

LC-MS does not automatically prove dose, sterility, endotoxin, or long-term stability. It mainly answers the identity question. A stronger report shows the mass result clearly and states whether the lab confirmed the peptide, a salt form, a copper complex, or another target form.

Assay / Net Content

Assay or net peptide content answers a different question: how much target material is in the vial compared with the label. This matters because a lyophilized vial can contain water, salts, counterions, buffer components, or fill variance. A purity number does not tell you whether a 100 mg label actually contains 100 mg of target.

Content results also depend on the reference standard, calibration, sample preparation, and validated range of the method. A precise value from one vial is still just one vial. Multi-vial testing gives a better picture of consistency.

Injectable-Safety Tests

Chemistry tests do not answer whether a product is suitable for injection. Sterility, endotoxin, elemental impurities, residual solvents, and particles are separate risks. For injectables, those categories matter as much as identity and purity.

Useful safety panels identify the actual method: sterility testing, including culture-based sterility testing such as USP <71>, endotoxin testing such as USP <85>, elemental impurities by ICP-MS, residual solvents by a solvent method, and visible or sub-visible particulates where applicable. Rapid PCR-style microbial screening can be useful, but it is not the same evidence as a compendial culture sterility test. A fentanyl screen can be an extra contaminant check, but it is not a sterility, endotoxin, metals, solvent, or particle panel.
Three Example Reports

The example set contains three vendor-provided COAs for the same nominal product: GHK-Cu, 100 mg. Vendor names are intentionally omitted. Testing lab names are retained because the comparison is about report structure and analytical evidence.

Category Report AReport BReport C
Testing lab ILS LaboratoriesTrustPointe AnalyticsFreedom Diagnostics
Report date 2026-06-092026-05-142026-04-22
Samples shown 3 samples5 vials1 sample
Identity evidence HPLC retention-time matchRT, spectral, and coelution controlsLC-MS identity with mass-confirmation graphic
Purity 99.62% primary; 99.57% mean99.692%-99.857%; 99.744% mean99.87%
Content vs. 100 mg label 106.09 mg primary; 105.94 mg mean97.170-101.020 mg; 98.744 mg mean109.81 mg
Safety coverage Metals, PCR sterility, USP <85> endotoxin, fentanyl screenNot shownNot shown
Main gap No LC-MS mass confirmation shownNo safety panel or LC-MS mass confirmation shownSingle-sample summary; no safety panel

Report A

Testing lab
ILS Laboratories
Report date
2026-06-09
Samples shown
3 samples
Identity evidence
HPLC retention-time match
Purity
99.62% primary; 99.57% mean
Content vs. 100 mg label
106.09 mg primary; 105.94 mg mean
Safety coverage
Metals, PCR sterility, USP <85> endotoxin, fentanyl screen
Main gap
No LC-MS mass confirmation shown

Report B

Testing lab
TrustPointe Analytics
Report date
2026-05-14
Samples shown
5 vials
Identity evidence
RT, spectral, and coelution controls
Purity
99.692%-99.857%; 99.744% mean
Content vs. 100 mg label
97.170-101.020 mg; 98.744 mg mean
Safety coverage
Not shown
Main gap
No safety panel or LC-MS mass confirmation shown

Report C

Testing lab
Freedom Diagnostics
Report date
2026-04-22
Samples shown
1 sample
Identity evidence
LC-MS identity with mass-confirmation graphic
Purity
99.87%
Content vs. 100 mg label
109.81 mg
Safety coverage
Not shown
Main gap
Single-sample summary; no safety panel

Report A: Broadest Safety Panel

Redacted Report A COA image
Report A, redacted two-page COA image. Open full-size report

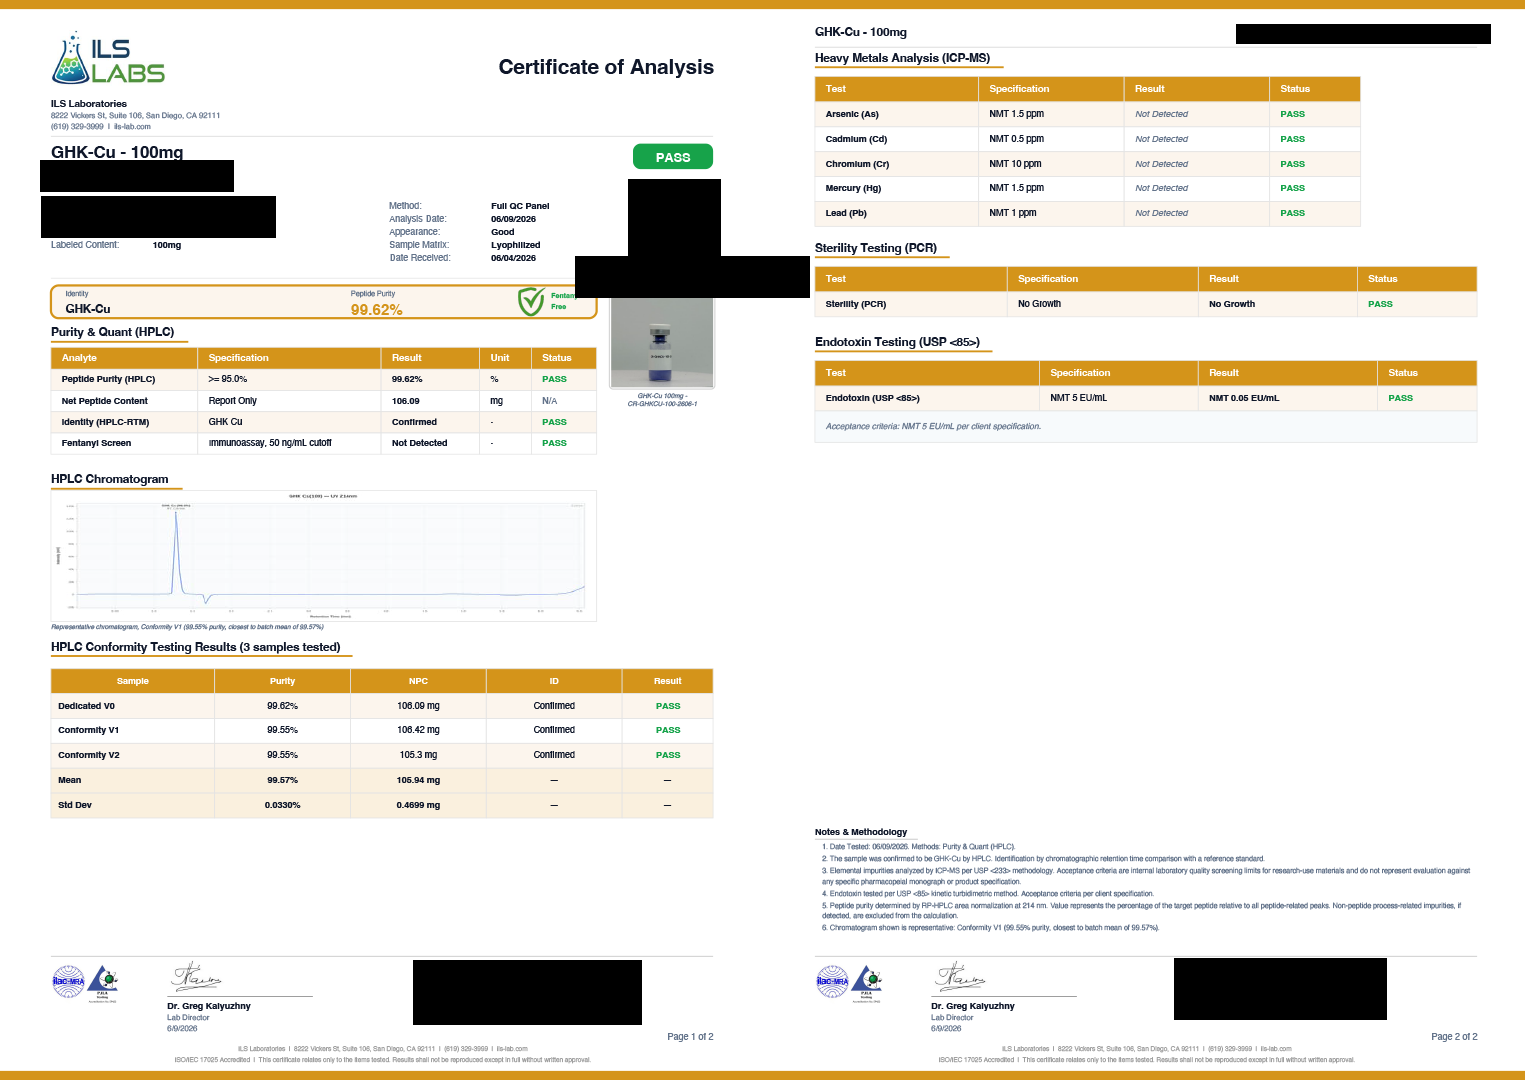
Report A is the strongest of the three on safety coverage. It reports HPLC purity of 99.62% on the primary sample, a three-sample mean of 99.57%, and net peptide content of 106.09 mg on the primary sample with a three-sample mean of 105.94 mg. It also includes heavy metals by ICP-MS, a sterility result labeled as PCR, endotoxin by USP <85>, and a fentanyl immunoassay.

The strength is breadth: this report attempts to answer more than just purity. The limitation is identity. The report says identity was confirmed by HPLC retention-time comparison with a reference standard, but it does not show LC-MS mass confirmation. Retention-time matching is useful, but it is not the same as molecular-mass confirmation.

The safety panel also needs careful reading. The metals table says not detected for arsenic, cadmium, chromium, mercury, and lead, but not detected is more interpretable when the report also shows detection limits. The sterility section is labeled PCR, which is not the same evidence as a compendial culture sterility test. The report does not show residual solvents or particulate testing.

Report B: Best Vial-to-Vial Consistency

Redacted Report B COA image
Report B, redacted two-page COA image. Open full-size report

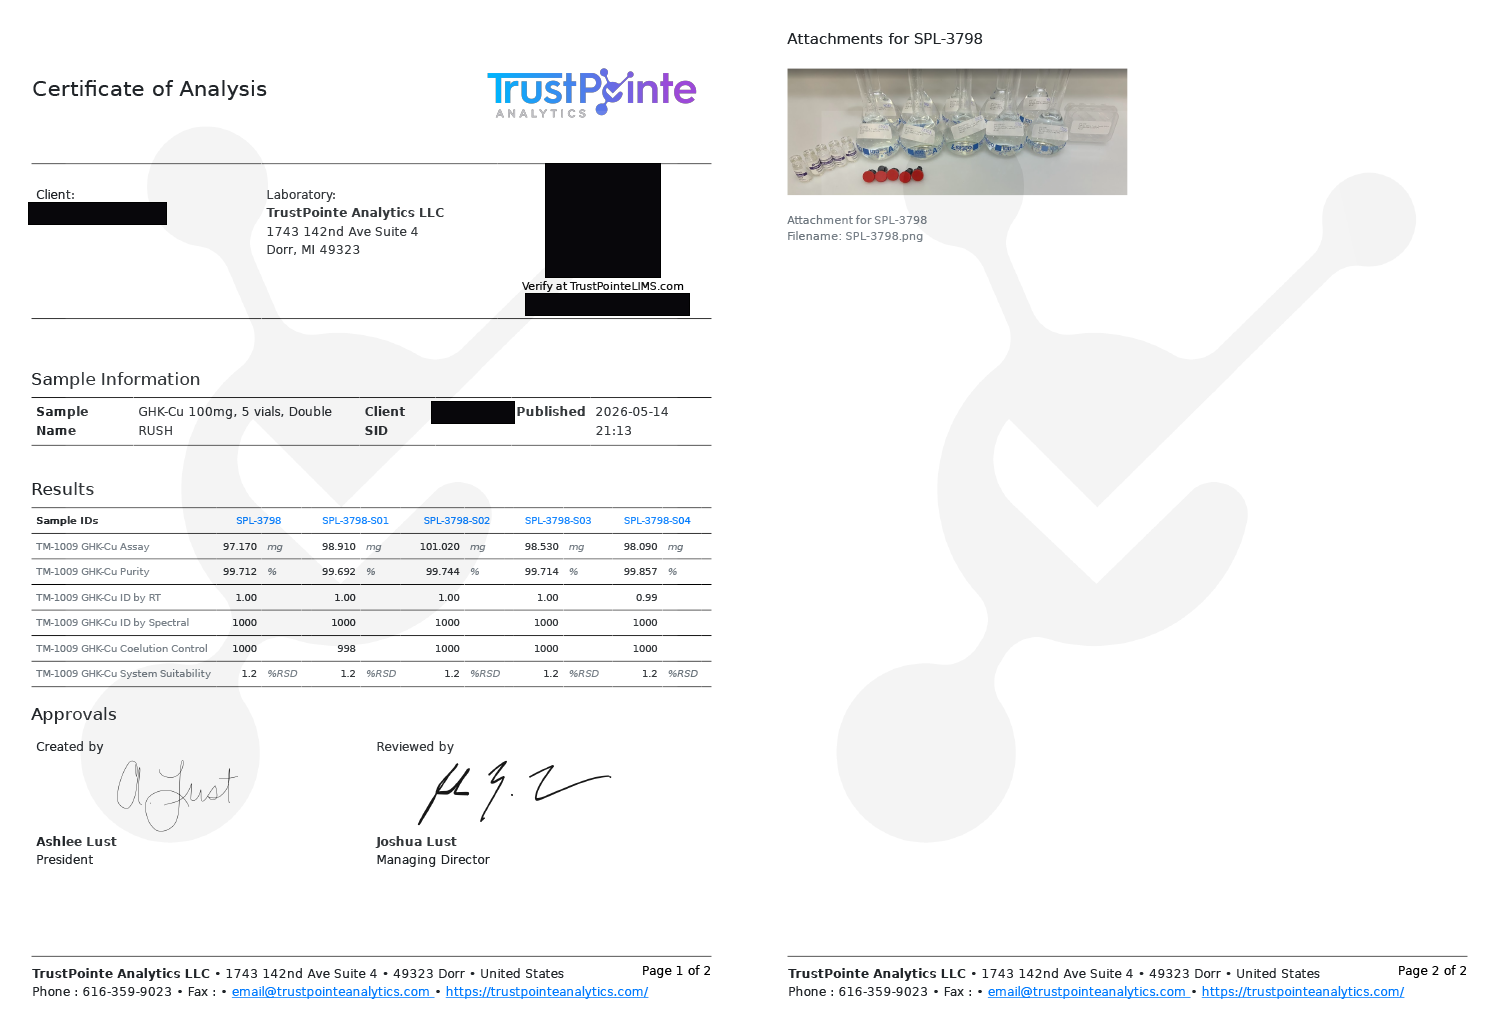
Report B is the strongest on sample count and consistency. It reports five vial-level assays: 97.170, 98.910, 101.020, 98.530, and 98.090 mg. The mean is 98.744 mg against a 100 mg label. The purity values range from 99.692% to 99.857%, with a mean of 99.744%.

It also reports several analytical controls: identity by retention time, spectral ID scores of 1000 across all five samples, coelution control values near 1000, and system suitability of 1.2% RSD. Those details are useful because they tell you the lab is checking more than a single purity number.

The weakness is that the report does not include an injectable-safety panel. There is no sterility, endotoxin, metals, residual solvent, or particulate result in the PDF. It also does not show LC-MS mass confirmation. The attachment page is a sample photo rather than raw chromatograms or spectra, so the underlying analytical traces are not inspectable from the report.

Report C: Strongest Identity Evidence

Redacted Report C COA image
Report C, redacted one-page COA image. Open full-size report

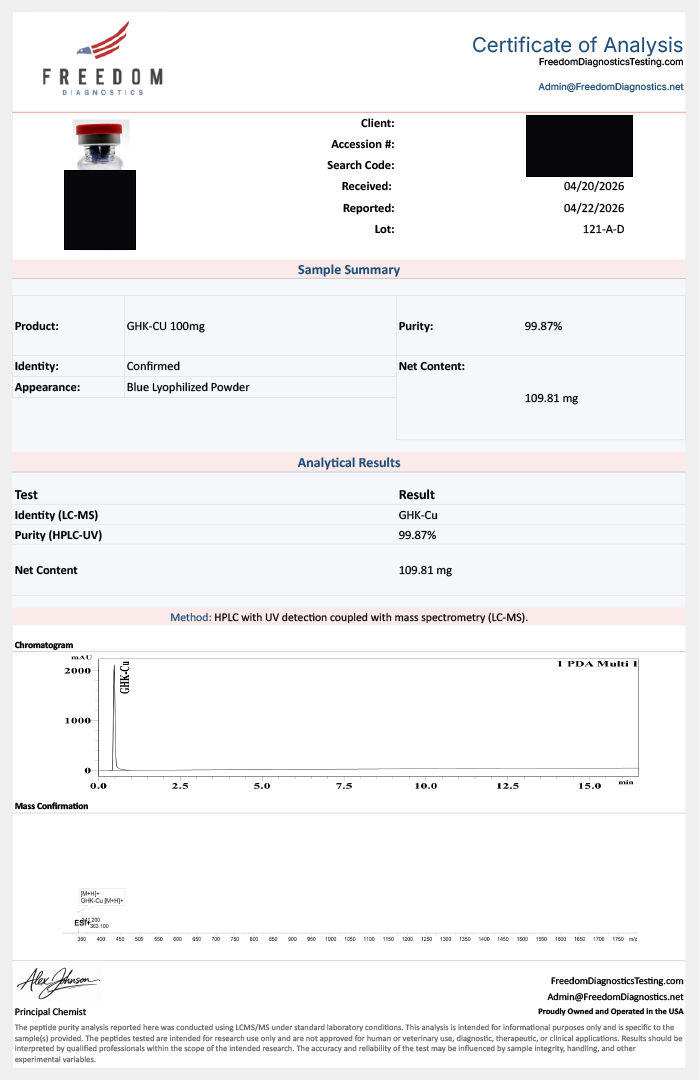
Report C is the strongest on identity because it explicitly reports LC-MS identity and includes a mass-confirmation graphic. It also shows an HPLC chromatogram and reports 99.87% HPLC-UV purity. The net content is 109.81 mg against a 100 mg label.

The limitation is scope. This is a one-page, one-sample summary with little method detail. It does not show multiple vials, a safety panel, residual solvent testing, particulate testing, or endotoxin testing. The 109.81 mg content result is meaningfully above the label claim, but a single result cannot tell you whether that reflects deliberate overage, fill variance, calibration, or method bias.

What The Comparison Shows

Best identity evidence

Report C, because it includes LC-MS mass-confirmation evidence.

Best content consistency

Report B, because it reports five vials and the mean assay is closest to the 100 mg label.

Best safety coverage

Report A, because it is the only one with metals, sterility, endotoxin, and fentanyl screening.

The ideal report would combine Report C's LC-MS identity, Report B's multi-vial content consistency, and Report A's safety-panel breadth. None of the three does all of that.

That is the central lesson. A high purity number is not the same thing as identity. Identity is not the same thing as dose. Dose is not the same thing as sterility. Sterility is not the same thing as endotoxin. A COA is only strong when the evidence matches the risk being claimed.

COA Checklist

  1. Does the COA name the lab, date, lot or sample ID, and a verification path?
  2. Can the report be tied to the specific batch being evaluated, or could it be generic or reused?
  3. Is identity confirmed by LC-MS mass, or only inferred from retention time, UV spectra, or a clean HPLC peak?
  4. Is HPLC purity backed by a chromatogram, not just a number?
  5. Is assay or net content reported in mg against the label claim?
  6. Were multiple vials or samples tested, or only one submitted sample?
  7. Is a phrase like full panel defined by actual tests, or is it only a marketing label?
  8. For an injectable, are sterility, endotoxin, elemental impurities, residual solvents, and particulates each addressed?
  9. Does each not-detected result include a method and useful detection limit?
  10. Is a fentanyl screen being presented as if it were a full safety panel?
  11. Are raw data, chromatograms, and spectra attached, or only a summary table or photo?
  12. Does the report leave a chain-of-custody gap between the tested sample and the vial being evaluated?

Passing this checklist still does not make a gray-market product safe. It only means the report is more complete. The remaining gaps are manufacturing oversight, chain of custody, storage, handling, and whether the tested sample is actually representative of the vial in front of you.

References